Healthcare data visualization transforms complex data into actionable insights that improve clinical decision-making and optimize patient outcomes. With the increasing reliance on big data in healthcare systems, the ability to interpret and present data effectively is essential. This article explores data visualization techniques, their impact on healthcare quality, and the future of AI-driven tools in the healthcare industry.
Understanding the Role of Data Visualization Tools in Healthcare
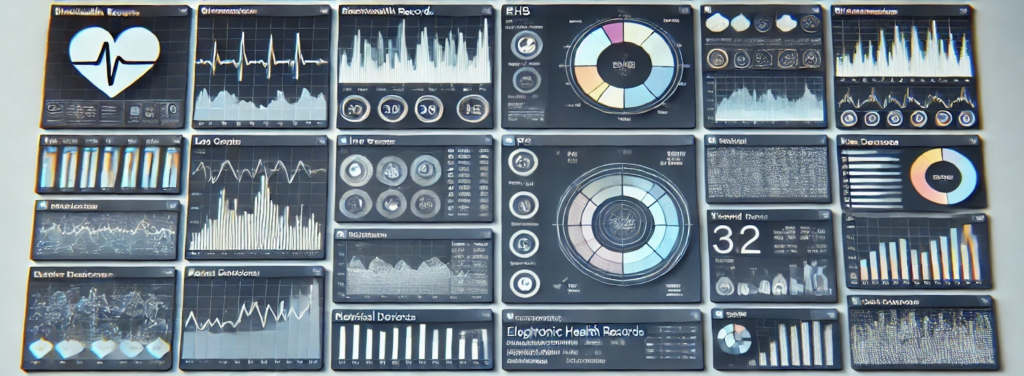
Healthcare organizations rely on vast amounts of raw data from multiple data sources, including electronic health records (EHRs), imaging, and real-time monitoring systems. Transforming this data into meaningful insights requires interactive visualization tools that facilitate data analysis and enhance the decision-making process.
The importance of data visualization in the healthcare industry comes from several key benefits:
Enhanced Decision-Making: Data visualization tools allow clinicians to quickly interpret patient data, improving accuracy in diagnosis and treatment.
Optimized Patient Monitoring: Real-time data visualization supports tracking patient health metrics, helping healthcare professionals adjust care plans as needed.
Improved Communication: Visualization of healthcare data bridges the gap between specialists, administrators, and patients, fostering transparency in the healthcare sector.
Resource Allocation: Healthcare providers use data analytics to optimize hospital capacity, staffing, and inventory management.
Personalized Care: AI-driven data analytics and visualization enable tailored treatment plans by analyzing historical data and predicting future healthcare trends.
Why Healthcare Data Visualization is Critical for Modern Medicine
The vast amounts of data generated in healthcare settings require efficient data analysis methods. Visualization in the healthcare industry is essential for processing large datasets, identifying patterns, and improving decision-making for both healthcare providers and policymakers. Stakeholders rely on these tools to assess health status, monitor treatment effectiveness, and enhance care delivery.
Interactive Dashboards for Real-Time Patient Monitoring

Real-time dashboards integrate interactive data visualization, consolidating information from various data sources such as EHRs, medical devices, and lab results. These dashboards allow healthcare organizations to track patient vitals, detect early warning signs, and adjust treatments accordingly.
A study on emergency department workflow optimization [1] highlights the role of visualization tools in improving clinical response times. The research found that interactive dashboards displaying real-time data visualization helped clinicians prioritize critical patients, optimize staffing, and enhance emergency room efficiency. This shift from static reports to dynamic, real-time monitoring improves overall patient outcomes and care.
Tools like Tableau provide an intuitive interface for healthcare professionals, allowing them to convert complex data into understandable insights. With visualization of data, clinicians can streamline workflows, reduce bottlenecks, and ensure rapid intervention in high-risk cases.
Predictive Analytics for Disease Risk Assessment

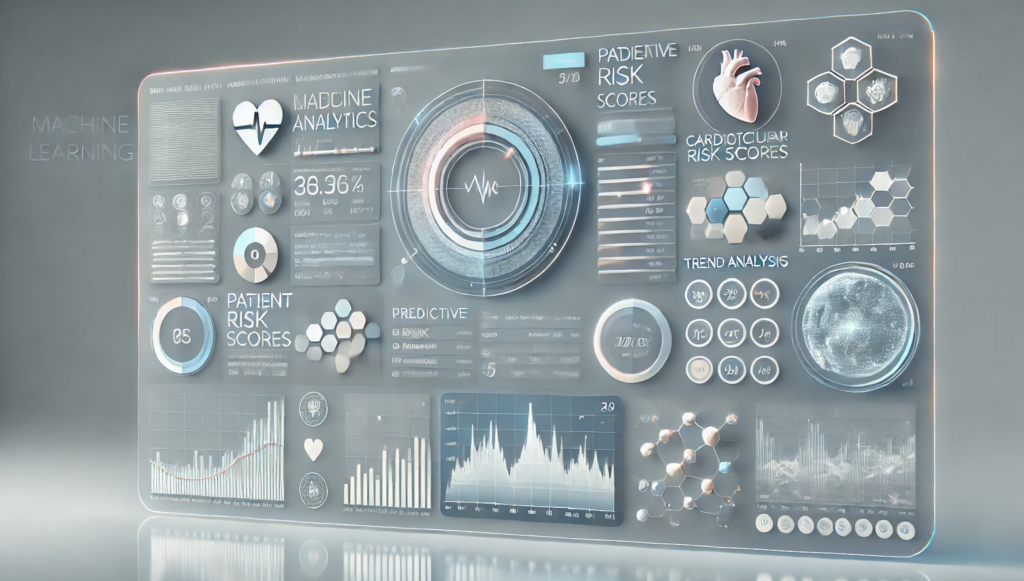
Machine learning models in data science have transformed data analysis in healthcare systems, allowing for early disease detection and personalized care. A study by Ibrahim and Saber [2] demonstrated how predictive analytics helps in identifying high-risk patients by analyzing historical data, genetic predispositions, and lifestyle choices.
By leveraging data analytics, healthcare software can generate individual risk scores for chronic conditions such as cardiovascular diseases and diabetes. This enables healthcare providers to implement targeted interventions, reducing hospitalization rates and improving overall healthcare quality. The integration of AI-driven data visualization tools ensures that insights from medical data are accessible to clinicians, aiding in effective clinical decision-making.
Pattern Recognition in Medical Imaging

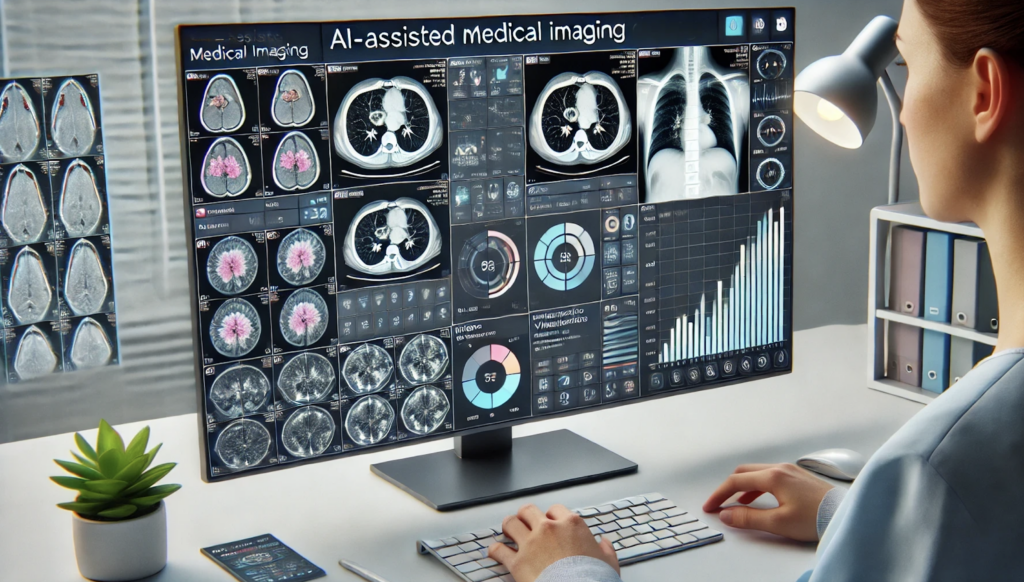
The use of AI in medical data analysis has significantly improved the accuracy of radiological interpretations. DenseNet, a machine learning model designed for pattern recognition, enhances healthcare software by detecting abnormalities in X-rays, MRIs, and CT scans [3].
This approach reduces diagnostic errors by analyzing visual data at a granular level, highlighting anomalies that may be overlooked by the human eye. The application of interactive visualization in imaging allows for quicker identification of disease markers, facilitating early diagnosis and improved patient outcomes. By integrating AI-driven intelligence tools, healthcare organizations can enhance efficiency in radiology departments and support stakeholders in making accurate diagnostic decisions.
The Future of Healthcare Data Visualization: Trends and Innovations
The next stage of data visualization in healthcare will be shaped by advancements in AI, automation, and real-time data visualization. As healthcare systems integrate big data from multiple data sources, new technologies will enhance clinical decision-making and improve patient outcomes.
Key innovations include:
AI-driven predictive modeling to refine disease risk assessments and personalize treatment plans based on historical data and genetic markers.
Augmented reality (AR) for surgical planning and interactive visualization of complex procedures, assisting surgeons in precision-based interventions.
Blockchain applications to improve data integration and ensure secure sharing data across healthcare institutions, enhancing transparency in the healthcare sector.
Advanced real-time monitoring systems that leverage wearable devices and IoT sensors to track patient health remotely, enabling early intervention.
Federated learning in data analytics, allowing AI models to train on decentralized medical data while maintaining patient privacy and security.
As healthcare trends continue toward predictive and preventive care, the role of AI and data science in visualization of healthcare data will expand, enabling stakeholders to make more informed and data-driven decisions.
Contact Us for AI-Driven Healthcare Data Visualization Solutions
We specialize in AI-driven tools designed to improve healthcare quality and support data-driven decision-making. Our expertise in data analytics and visualization helps healthcare professionals and organizations harness medical data effectively. Contact us to explore customized solutions that enhance insights, optimize workflows, and drive innovation in the healthcare industry.
References
Franklin, Amy, et al. “Dashboard visualizations: Supporting real-time throughput decision-making.” Journal of biomedical informatics 71 (2017): 211-221.
Ibrahim, Mohamed Said, and Sameh Saber. “Machine learning and predictive analytics: Advancing disease prevention in healthcare.” Journal of Contemporary Healthcare Analytics 7.1 (2023): 53-71.
Zhou, Tao, et al. “Dense convolutional network and its application in medical image analysis.” BioMed Research International 2022.1 (2022): 2384830.
Q: How does data visualization in healthcare help improve patient care?
A: Data visualization plays a crucial role in improving patient care by allowing healthcare professionals to quickly interpret patient data and identify areas for intervention. By visualizing health data, providers can make informed decisions that enhance patient outcomes and streamline care management.
Q: What are some leading tools for health data visualization?
A: Some leading tools for health data visualization include Tableau, Power BI, and various visual analytics platforms that help convert large volumes of health data into actionable insights. These tools support the creation of several interactive reports that can aid in strategic decision-making.
Q: How can electronic health records (EHR) benefit from visual analytics?
A: Electronic health records can benefit from visual analytics by providing healthcare providers with a comprehensive view of patient’s health through visual tools. This can help in monitoring health trends, managing patient data effectively, and enhancing overall care management.
Q: What types of visual tools are commonly used in healthcare data analysis?
A: Common visual tools used in healthcare data analysis include dashboards, charts, graphs, and heat maps that display various visualization types. These tools help in analyzing health data, tracking patient outcomes, and supporting informed decision-making within healthcare facilities.
Q: How can using data visualization enhance patient engagement?
A: Using data visualization can enhance patient engagement by providing patients with clear, understandable representations of their health data. This empowers patients to take an active role in their care, leading to better health management and improved overall outcomes.

