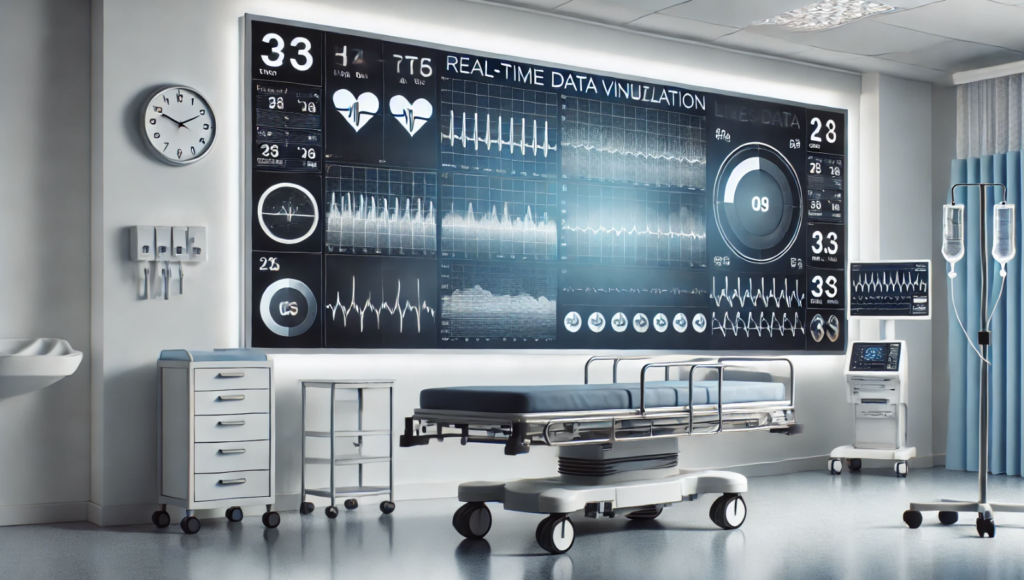
Healthcare data visualization transforms complex medical information into clear, actionable insights, helping healthcare professionals make informed decisions quickly. In a field where timing and accuracy are critical, visualizing large datasets allows healthcare providers to better understand trends and improve patient outcomes. By organizing raw data from multiple sources, healthcare organizations can use visualization tools to enhance diagnoses, track population health trends, and improve overall patient care.
The Importance of Data Visualization in Healthcare
The use of data visualization in healthcare is growing for several important reasons:
Improved Decision-Making: Data visualization techniques allow healthcare providers to interpret complex datasets quickly, leading to more accurate and timely decisions in patient care.
Increased Transparency: Visual representations make healthcare processes and performance more transparent, improving communication between healthcare teams and patients.
Enhanced Data Exploration: Visualization tools allow healthcare professionals to explore large datasets, identifying trends and patterns in healthcare quality, patient outcomes, and treatment effectiveness.
Real-Time Monitoring: Real-time data visualization helps healthcare providers monitor patient data in real time, allowing for quicker adjustments in care and better management of critical conditions.
Public Health Management: Visualization techniques help public health organizations track disease outbreaks, vaccination rates, and population health metrics more effectively.
Key Benefits of Healthcare Data Visualization
Modern healthcare data visualization is highly versatile and supports a wide range of applications, from clinical decision-making to public health management. Below are some key examples of how visualization tools can improve healthcare operations.
Visualization Tools for Clinical Data

Several tools are transforming the way healthcare professionals interpret and use data. Tableau is a leading platform known for its ability to seamlessly integrate data from various sources. This flexibility allows organizations to create real-time dashboards that present data in visually engaging ways, simplifying the interpretation of complex clinical information. By enabling healthcare providers to track trends in patient care, outcomes, and treatment efficiency, Tableau empowers clinicians to make data-driven decisions faster and with greater confidence.
Power BI is another powerful tool used widely in the healthcare sector. This platform is highly customizable, allowing organizations to tailor reports and dashboards according to specific needs. With its ability to handle large datasets in real-time, Power BI enables healthcare professionals to visualize trends and performance metrics easily, providing a clear view of both individual patient data and overall operational efficiency. It has become a critical tool for healthcare analytics, helping streamline workflows and improve healthcare quality across organizations.
D3.js, an open-source JavaScript library, offers unmatched flexibility for developers looking to create interactive and highly specific visualizations. Unlike other tools, D3.js allows organizations to design custom data visualizations that can handle complex data from multiple sources. This tool is particularly useful in scenarios requiring unique visual representations, such as tracking the progression of diseases across populations or analyzing large sets of medical data for research purposes. By providing the ability to build tailored visualizations, D3.js enables healthcare professionals to focus on what matters most in their data.
Using Data Visualization Techniques to Improve Public Health

Data visualization techniques in healthcare play a crucial role in enhancing public health efforts by transforming vast amounts of data into actionable insights. One key application is in the tracking of disease outbreaks. Visualization tools help healthcare providers and public health officials monitor the spread of diseases by analyzing real-time data from various sources, enabling faster and more effective responses to public health crises. By visualizing patterns and trends, these tools can identify emerging hotspots and help allocate resources more efficiently.
In addition to disease tracking, data visualizations are instrumental in monitoring vaccination coverage. Public health organizations use these tools to track vaccination rates across different regions, providing insights into areas that require more attention or are lagging in coverage. This helps in addressing gaps and ensuring more effective resource distribution, ultimately leading to improved public health outcomes.
Moreover, visualizing population health metrics allows organizations to manage long-term health trends, identify at-risk populations, and improve the overall management of public health initiatives. By presenting complex data in an easily digestible format, healthcare providers can develop more targeted interventions and improve the effectiveness of public health programs.
Improving Patient Care with Real-Time Data Visualizations

Real-time data visualizations are revolutionizing patient care, allowing healthcare providers to access up-to-date patient information and make more personalized treatment decisions. This capability is particularly important in intensive care units, where continuous monitoring of patients is required. Interactive dashboards displaying real-time patient data—such as heart rate, oxygen levels, and other vital signs—help clinicians respond more quickly to changes in a patient’s condition, potentially saving lives.
These interactive data analytics and visualization also enable the development of more personalized treatment plans. By providing a comprehensive view of a patient’s medical history, ongoing treatments, and current health status, healthcare professionals can tailor interventions more effectively. This not only improves patient outcomes but also enhances the overall efficiency of healthcare delivery.
In outpatient settings, these technologies help streamline the monitoring of chronic conditions. Patients with diabetes or cardiovascular disease, for example, can benefit from continuous tracking of their health data, allowing for timely adjustments to treatment plans based on their progress. As healthcare moves toward more personalized care, real-time data visualization will be a key tool in delivering more proactive and patient-centered healthcare.
The Future Importance of Clinical Data Visualization
As healthcare continues to evolve, the role of clinical data visualization will become even more crucial. Here are a few key advancements to expect:
AI Integration: The combination of AI and data visualization will enable predictive analysis, helping healthcare providers detect health trends and make faster, more accurate decisions.
Advanced Data Analytics: Future visualization tools will incorporate more advanced analytics, providing healthcare organizations with deeper insights into patient data and treatment outcomes.
Wearable Devices Integration: Data from wearable devices will be increasingly integrated into visualization platforms, allowing for continuous monitoring of patient health in real-time.
Enhanced Patient Engagement: Visualization tools will also focus on engaging patients by providing them with easy-to-understand visual representations of their health data, promoting proactive healthcare participation.
Visualize Your Healthcare Data with AI Integration
Neural Board specializes in implementing AI-driven data visualization solutions to enhance healthcare systems. Contact us today to learn how we can help your organization visualize healthcare data and improve patient care.
Q: What are healthcare data visualization tools?
A: Healthcare data visualization tools are software applications designed to help healthcare organizations analyze and present medical data in a visual format. These tools enable users to create interactive data visualizations that can enhance the understanding of complex patient data and healthcare quality metrics.
Q: How does medical data visualization improve patient care?
A: Medical data visualization allows healthcare professionals to quickly identify trends and patterns in patient health data. By visualizing this information, clinicians can make more informed decisions, leading to improved patient outcomes and overall healthcare quality.
Q: What types of data sources are typically used in healthcare data visualization?
A: Common data sources used in healthcare data visualization include electronic health records (EHRs), clinical trial data, patient health surveys, and administrative data from healthcare organizations. These diverse data sources provide a comprehensive view of patient health and healthcare delivery.
Q: What are the benefits of using data visualization in the healthcare industry?
A: Data visualization in the healthcare industry enhances the ability to communicate complex medical data effectively. It helps stakeholders, including healthcare providers and administrators, to identify areas for improvement, track performance metrics, and ultimately enhance the quality of care provided to patients.
Q: How can interactive data visualization enhance the analysis of medical data?
A: Interactive data visualization allows users to engage with the data by filtering and drilling down into specific areas of interest. This dynamic approach enables healthcare professionals to explore patient data visualization in greater detail, facilitating deeper insights and better decision-making.
Q: What role does healthcare software play in data visualization?
A: Healthcare software plays a crucial role in data visualization by integrating various data sources and providing the necessary tools to create visual representations of medical data. These software solutions often include features that allow for easy customization and sharing of visualizations among healthcare teams.
Q: Can you provide examples of different visualization techniques used in healthcare?
A: Different visualization techniques used in healthcare include bar charts for comparing patient populations, line graphs for tracking patient progress over time, heat maps for identifying areas of high healthcare utilization, and dashboards that combine multiple data visualizations for a comprehensive overview of healthcare quality metrics.
Q: How does visualization of healthcare data impact decision-making in healthcare organizations?
A: The visualization of healthcare data significantly impacts decision-making by providing clear, visual representations of complex information. This enhances the ability of healthcare organizations to identify trends, allocate resources effectively, and implement strategies to improve patient care and operational efficiency.
Q: What challenges do healthcare organizations face when implementing data visualization tools?
A: Challenges in implementing data visualization tools in healthcare include data integration from multiple sources, ensuring data accuracy and quality, user training on visualization software, and overcoming resistance to change among staff. Addressing these challenges is crucial for successful adoption.
Q: How can healthcare facilities ensure they are effectively using data visualization tools?
A: Healthcare facilities can ensure effective use of data visualization tools by providing training for staff, selecting user-friendly software, regularly updating data sources, and fostering a culture of data-driven decision-making. Regular assessments of visualization effectiveness can also help refine processes and improve outcomes.
Q: What are the primary benefits of data visualization for healthcare?
A: The primary benefits of data visualization for healthcare include improved transparency in the healthcare sector, enhanced understanding of complex healthcare data, and better decision-making through clear visual data representation.
Q: How do data visualization tools allow for better analysis of patient data?
A: Data visualization tools allow for better analysis of patient data by transforming huge amounts of data into visual formats that are easier to interpret, enabling healthcare professionals to quickly identify trends and make informed decisions.
Q: What role does visualization of data play in improving healthcare quality?
A: Visualization of data plays a crucial role in improving healthcare quality by highlighting areas that need attention, monitoring performance of healthcare services, and facilitating communication between healthcare providers and patients.

